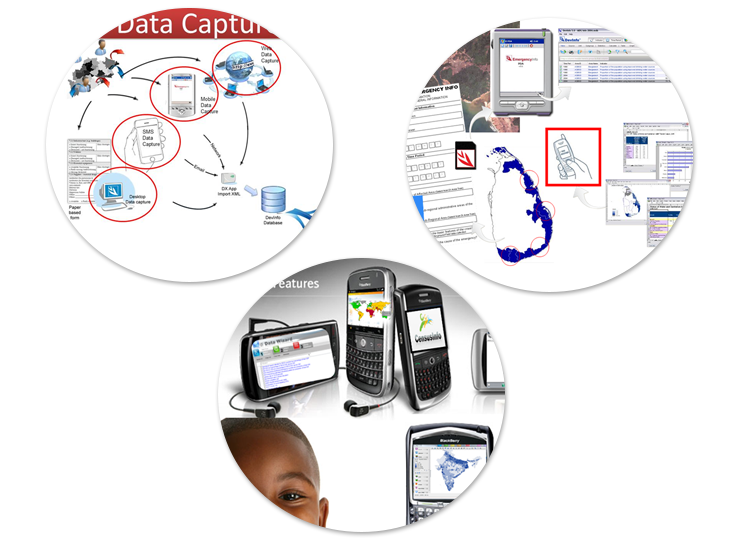
Bridging the information gap in the event of an emergency! AISPL master’s the development of the software system that helps you do exactly the same.

resources. The system can generate a time series of maps to effectively monitor progress the response to a disaster. The system can be used to store presentation outputs in the gallery and disseminate information over a local network, or convert it into online web gallery to share information over the internet to a wider audience.

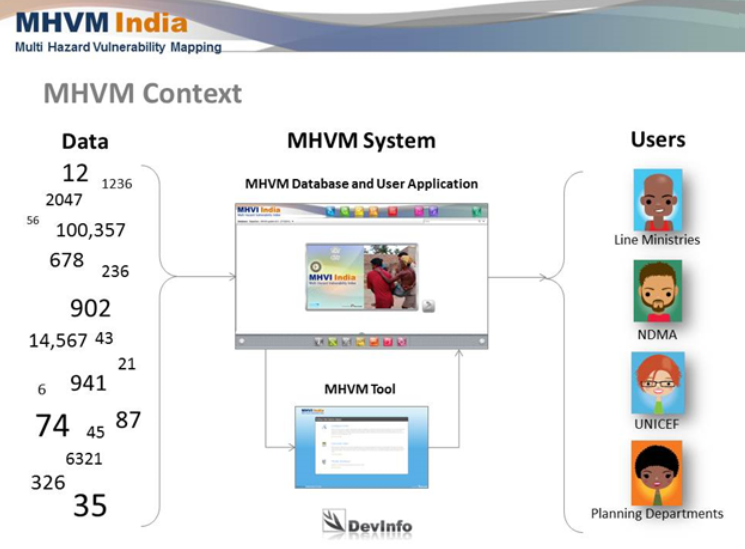
policy-maker can study which are the most vulnerable to a disaster. MHVM calculates the most vulnerable districts are the ones where relatively high density of population, vulnerability to hazard and poor economic situation of people (together forming the Base Index). Using the sectoral indexes, a policy-maker can study the impact on various sectors – various aspects of people’s lives. The MHVM tool is therefore is an excellent tool for reducing risk by being aware of the consequences of disaster in the districts, and directing resources for making these districts more resilient so that the impact of disaster is minimized in the event of a disaster.