Key Facts
| Sponsor | UNICEF |
|---|---|
| Duration | December 2022-2024 |
| Project Link | Home | Système d'Information Sociale (dataforall.org) |
| Stakeholder | DNPSES and DNDS |
| Features | DFA Dashboard, DFA Survey Application, DFA Data Manager, DFA Visualizer, Metadata Hub, Library, DFA Portal |
| Geography | Mali |
Highlights
- The Direction Nationale du Développement Social (DNDS) and Direction Nationale de la Protection Sociale et l'Économie Solidaire (DNPSES) of Mali have been collecting data on social services for many years and faced challenges related to data collection, data quality and processing in a paper based system called SISo.
- Avalon/CSF was mandated to digitize the Social Information System (SISo) for them.
- We designed and developed the digital platform and supported its implementation in 140 communes of two regions.
- This SISo digital platform has been designed in such a way that it helps enumerators on the field to collect data, reviewers to do quality check and view oversee the operation side of the data collection on an operational dashboard and then the data is published and analytics are generated.
Scope of Work
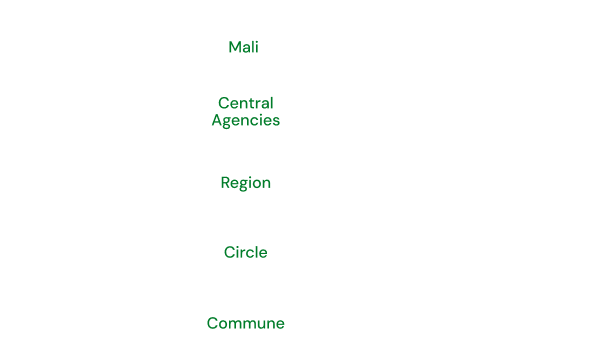
In December 2022, CSF/Avalon was commissioned by UNICEF Mali to develop a survey application for the Mali government with the aim to assist in the collection of data from the 900 communes, circles and regions for various frequencies. The paper based system that was being used for 10 years, has proved to be inefficient, and a digital solution was needed to improve the data ecosystem.
Executive summary
Mali figures at the 186th place in the UNDP Human Development Index of 2021. To better serve the population, the various departments of the government are mandated to regularly collect data for a clearer understanding of what is happening on the ground, and hence design better programmes to serve the population. The two departments of the Ministry of Health, DNPSES and DNDS have been struggling during the last years to collect data for their statistical yearbook. The digital platform will help improve the data collection processes and also provide quick access to analytics. Looking at the prevailing socio-political instability, and various climate shocks, the priority sectors of these two departments aim to strengthen the social protection system in the country.
Challenges
The Système d’information Sociale (Social Information System), SISo Mali, collects data at all geographic levels to acquire the requisite national level data for various indicators. But at the same time, employing traditional, paper based data collection method came with its own set of challenges :
- Misplacement of data form
- Form duplication
- Data inconsistency
- Unreliable data cleaning
- Compromised data security
Such challenges largely impeded the efficiency of the data collection, compilation and analysis process. Due to its high reliability of manual interventions, generating analysis would take time and delay decision-making. We helped to streamline the process by developing a mobile application facilitating data collection, and a web platform to facilitate data analysis, review and dissemination.
Our Approach
Assisting the country’s transition from paper-based data collection to a digital mode of data capture was a novel initiative that came to fruition with the SISo Mali digital platform. Given the magnitude/scope of the project several key considerations and activities were taken up :
1. Interactive needs assessment sessions
The project posed a two pronged challenge; one was to develop an understanding of the complexities encountered on the field level, and the other was to make the dream of digitization of the process into reality and unlock its potential for this context. Thus, at the inception of this project, Avalon conducted various meetings with the DNPSES/DNDS teams to gather:
- An in-depth understanding of the initiative,
- To review questionnaires and classify them against the key performance indicators, data collection frequency and area levels,
- Matching of the indicators to the questions in the questionnaire,
- Discuss the structure and content of the digital form,
- Design of the data collection form
2. Desk Review & Planning
Equipped with the knowledge gathered during the inception phase, we reviewed the paper based form (containing over 100 tables) to map out key performance indicators which would later be fed into the data management system.
3. Digital Platform Development
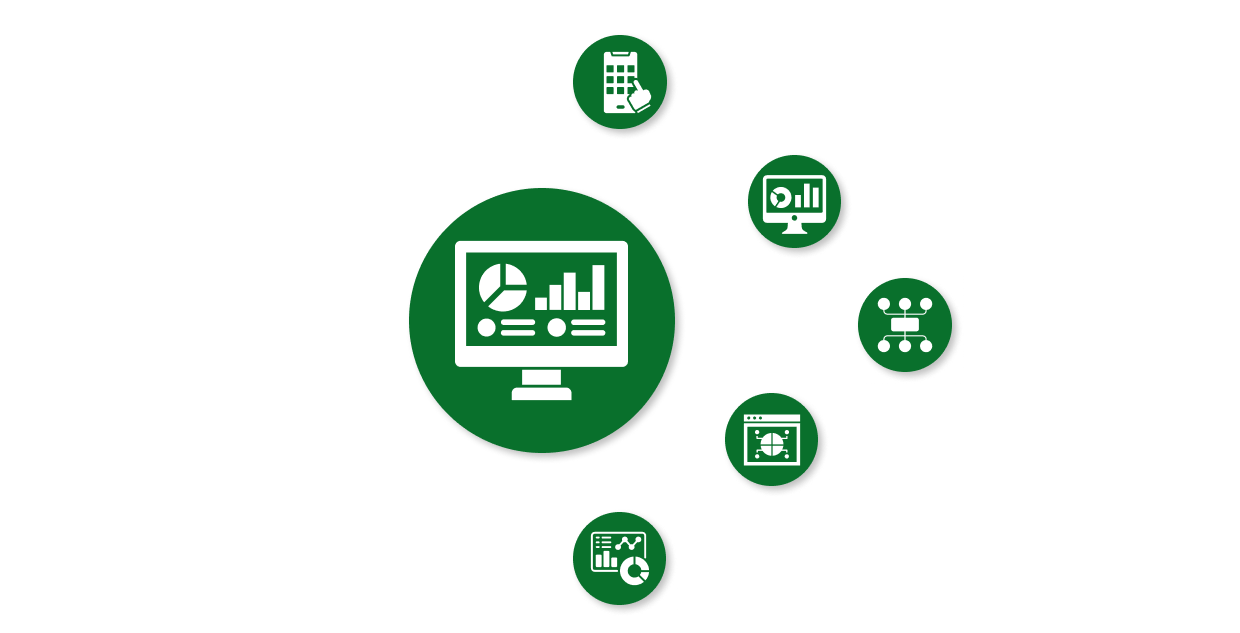
For the digital platform, we leveraged some of the tools from the DFA Toolkit, like the DFA Data Manager, DFA Dashboard Builder, DFA Visualizer & the DFA Survey. Extensive brainstorming and discussions with the stakeholders allowed us to provide comprehensive and tailor-made digital solutions.
The mobile and web applications were developed with features specially designed to suit the needs of the program
- Mobile application : The flutter based data capture tool was specially designed to cater to the needs of remote users/enumerators; meaning, it needed to function offline, contain notifications and also be able to assign multiple areas to one enumerator. Several added features like in-app tutorials & enumerator notes were added to facilitate the data collection process.
- Development of the data warehouse : The development of the data warehouse that would contain the KPIs, and handle various types of disaggregations while being mapped to the variables in the mobile app was a huge task. The Data Manager has been used for the data warehouse management and a Calculate Engine has been setup to aggregate data from lowest geographical level to the national level and also to calculate percentage indicators.
- Web application : The web application was developed for the purpose of data analysis, data cleaning/review and dissemination. Housed with several powerful tools, the web application strongly supported the stakeholder decision-making process.
- Data review : Considering the needs of the program, the web application was developed to be used by administrators and the data reviewers. These reviewers would have access to the areas configured to their account and would either approve or reject the responses based on their quality.
- Monitoring operations : An operational dashboard and a suite of reports have been provided to help the administrator and the reviewers understand what is happening on the field, and monitor the operations.
Data dissemination : Once the reviewer has approved the data received from various area levels, the information is then published to the indicator based data warehouse and mapped to the KPIs. The indicator data are then disseminated using the DFA dissemination tools like the DFA Dashboard and the DFA Visualizer.
Implementation

Regions
Koulikoro
Ségou

Surveyed areas
12Circles
140Communes

Enumerators
19

Reviewers
15
Data Warehouse
# of indicators (Number)
1225
# of indicators (Percentage)
150
Time periods
2
Data points
40,000
Input
- 6 data collection forms were developed.
- For each geographic level, forms have been designed for annual, quarterly and bi-annual frequencies.
- Number of questions in forms range from 20 - 115.
Data analysis
Decision-making tools like the DFA Dashboard and the DFA Visualizer are available to view the performance of key indicators.
Question Type
- Dropdown
- Textbox
- Numerical
- Radio Button
- Checkbox
- Table
Operational Dashboard
Powerful tool for the administrator and reviewers to understand the field related activities.
Reports
A rich suite of reports provides a comprehensive overview of the operations. These reports cover a wide array of areas like :
- Assigned/unassigned Enumerators/Reviewers,
- Rate of completion of responses
- Reviewer performance report
- Response report
- Missing responses report
- Survey report
- Transaction logs
Calculate Engine
- Data collected in survey responses get transformed and mapped to key indicators.
- The Calculate Engine generates Totals (Male + Female), percentages. It also subtotals the data collected at communes through a vertical aggregation to generate data at the national level.
- This tool has been newly developed for the SISo project and can be adapted to any data warehouse.
Impact & Benefits

Faster Data Collection & Processing
Data is uploaded instantly to the centralized system, eliminating delays caused by physical transportation of forms.

Improved data monitoring & decision-making
Integrated data validations algorithm to reduce errors. Built-in checks, drop-down menus prevent entry of incorrect data.

Enhanced Data Accessibility
Integrated roles and permissions regulates who does what in the system. Regular back-ups prevent data loss.

Scalability & Customization
Real time insights through analytics. Immediate access to data supports timely and informed decision-making.

Improved Data Accuracy
Centralized data warehouse and one stop data portal allows easy sharing on insights and information on the program.

Increased Data Security
Scalable data warehouse that can host data for multiple reporting frequencies. Tools like surveys, dashboards are all scalable and edits can be done as per the program needs.
Login or Register to post comments.